

July 16, 2026 · 10 min read
How to price your product right: the Van Westendorp method
You have an idea, maybe even a half-built product, and one question you keep dodging: what do I charge for this? Pick a number too low and you leave money on the table and signal "cheap." Pick too high and nobody bites. Most founders resolve it by copying a competitor, adding a nine at the end, and hoping.
There's a better way to price your product right, and it predates SaaS by decades. The Van Westendorp Price Sensitivity Meter is four questions, a simple graph, and about an afternoon of work. It won't hand you a magic price. Nothing will. But it turns "I have no idea what to charge" into "here's the range real buyers will accept, and here's where resistance is lowest." This post walks the whole method: the four questions, how to run it, how to read the graph, and the places it quietly misleads you.
What the Van Westendorp Price Sensitivity Meter actually is
The Van Westendorp Price Sensitivity Meter (PSM) is a pricing research technique that reads willingness to pay from how people describe a price, not from a single "what would you pay?" question. Dutch economist Peter van Westendorp introduced it at the 1976 ESOMAR Congress, and it has survived fifty years because it does something clever: instead of the researcher guessing price points to test, respondents supply the prices themselves, in their own frame of reference.
You ask four questions about the same product. Each asks for a price — too cheap, a bargain, getting expensive, too expensive. You collect answers from a group of target buyers, plot them as cumulative curves, and the places those curves cross tell you the range of prices the market finds acceptable and the point of least resistance. That's the whole idea: a range and a shape, not a false single number. It's the closest thing a founder has to a repeatable way to price a product right instead of guessing. If you've read our take on why a range beats a made-up score, this will feel familiar — same philosophy, applied to price.
The four questions
Everything rests on getting the wording right. Show the respondent your product first: a clear description, a demo, a mockup, so they're pricing the same thing you are. Then ask, in this order:
| # | Question | What it captures |
|---|---|---|
| 1 | At what price would this be so cheap that you'd question its quality? | Too cheap (lower floor) |
| 2 | At what price would this be a bargain — a great buy for the money? | Cheap / good value |
| 3 | At what price would this start to feel expensive, but you'd still consider it? | Getting expensive |
| 4 | At what price is this so expensive you would not consider buying it? | Too expensive (upper ceiling) |
Two things matter here. First, they're open-ended — the respondent types a number, you never show them options. That's the method's signature strength: no anchoring from a price list you invented. Second, the order runs cheap to expensive, which keeps people thinking in a consistent direction.
One sanity check pays for itself: a valid response has question 1 ≤ 2 ≤ 3 ≤ 4. If someone's "too cheap" price is higher than their "too expensive" price, they misread the questions. Drop those responses before you graph anything.
How to run the survey
You don't need a panel provider or expensive tooling to start. You need the right people and clean data.
-
Survey actual buyers, not your network. This is the one that kills most DIY pricing research. Your friends, your Twitter followers, and anyone who likes you will over-price to be encouraging. Recruit people who match your real target customer — a niche subreddit, a relevant Slack or Discord, existing users of a competitor, your waitlist.
-
Get enough responses to see a shape. Textbook practice wants a few hundred per segment. As a founder you can act on far less: 30 to 50 real target buyers gives you a directional read. Just be honest that small samples give you a rough range, not a decimal-point answer.
-
Segment if your buyers differ. A solo hobbyist and a 50-person company will price your tool completely differently. If you serve distinct segments, run the four questions per segment — a blended curve across both is noise that averages two real answers into one fake one.
-
Show the product before you ask. Perceived value drives every answer. A vague description gets you vague, low prices. A crisp value proposition and a visible outcome lifts the whole curve — and reflects reality better.
-
Export the four columns and clean them. One row per respondent, four price columns. Strip currency symbols, drop the responses that fail the 1 ≤ 2 ≤ 3 ≤ 4 order check, and you're ready to graph.
How to read the graph — the four price points
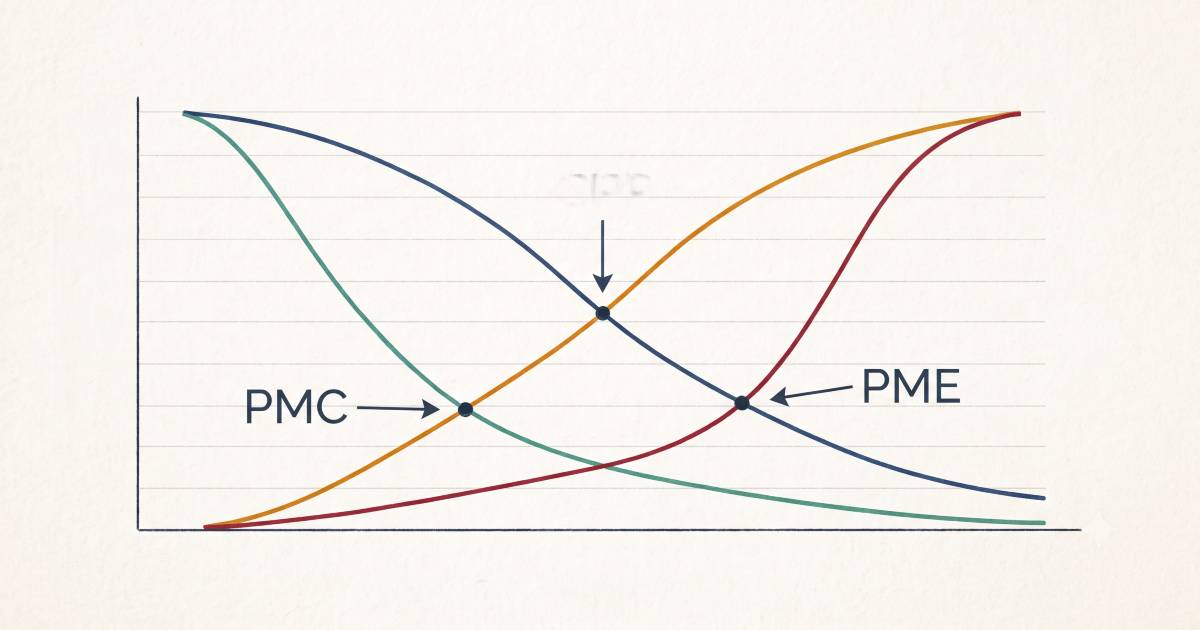 The four cumulative curves and where they cross. PMC and PME bound the range of acceptable pricing; OPP is the point of lowest resistance. Illustrative shape, not to scale.
Here's where it clicks. You build four cumulative curves across a price axis, then read the intersections. Don't let the jargon scare you; each crossing has a plain meaning.
Plot the percentage of respondents against price. The "too cheap" and "cheap/bargain" curves are drawn as reverse-cumulative (they fall as price rises — fewer people call a higher price cheap). The "expensive" and "too expensive" curves are cumulative (they climb as price rises). Four crossings fall out:
| Intersection | Crossing of | What it tells you |
|---|---|---|
| PMC — Point of Marginal Cheapness | "too cheap" × "expensive" | Lower bound. Below this, quality doubts start costing you sales. |
| PME — Point of Marginal Expensiveness | "too expensive" × "cheap/bargain" | Upper bound. Above this, price rejection accelerates. |
| OPP — Optimal Price Point | "too cheap" × "too expensive" | Lowest resistance — fewest people reject on either extreme. |
| IPP — Indifference Price Point | "cheap/bargain" × "expensive" | The "normal" price — equal numbers see it as cheap and as expensive. Often the market leader's price. |
The span between PMC and PME is your Range of Acceptable Pricing (RAP) — the band where the market won't flinch on price grounds alone. The OPP sits inside it as the point of least resistance, and the IPP tells you where the psychological "market rate" sits, which is useful for knowing whether you're positioning above or below the incumbent.
Read it as a decision, not a readout. A wide RAP means the market is price-tolerant and you have room to charge more or to test tiers. A narrow RAP means buyers are picky and you'd better nail positioning. If your OPP lands well below your unit economics, that's not a pricing problem — that's the market telling you this product is worth less than it costs you to deliver.
How to graph Van Westendorp in a spreadsheet (Excel or Sheets)
You don't need Sawtooth or a stats package. In Google Sheets or Excel:
- Build a price scale down column A — every price from your lowest answer to your highest, in sensible steps ($1, $5, whatever fits your range).
- For each price row, compute the percentage of respondents whose answer puts them in each of the four states at that price. "Too cheap" and "cheap" are cumulative from the top down (percentage who said that price or higher is too cheap / a bargain); "expensive" and "too expensive" are cumulative from the bottom up.
- Plot all four as lines on one chart, price on the x-axis, percentage on the y-axis.
- Read the crossings by eye — that's genuinely how the classic method works. For a precise number, interpolate between the two rows where each pair of lines swaps order.
Fifteen minutes of formulas and you have the same chart the pricey tools draw. Or skip the spreadsheet entirely: our free interactive SaaS pricing calculator teaches the method as you scroll and reads your pasted survey answers on the spot.
What Van Westendorp gets right — and where it lies to you
The method's strengths are real: it's cheap, fast, needs no pre-set price points, and asks people to think in ranges the way they actually shop. For a founder with no pricing data, it beats guessing by a mile.
But treat it as one input, not a verdict, because it has three honest limitations:
- It measures acceptability, not demand. Van Westendorp tells you what price feels fair. It says nothing about how many units sell at that price. "Acceptable" and "will actually buy" are different questions, and revenue lives in the second one. This is the big one.
- The prices are hypothetical. People answer as if spending money they aren't spending. Stated willingness to pay reliably overstates the real thing — a known gap between what buyers say and what their credit card does.
- It's blind to volume and revenue. Because there's no purchase-likelihood signal, you can't build a demand curve or find the revenue-maximizing price from Van Westendorp alone.
The standard fix is to pair it with Gabor-Granger, which asks how likely someone is to buy at specific prices and does give you a demand curve and a revenue-maximizing point. Use Van Westendorp to find the acceptable range, then Gabor-Granger to optimize within it. Some practitioners also add a purchase-intent question to Van Westendorp itself (the Newton-Miller-Smith extension) to bolt a demand estimate onto the range.
Price is the second question, not the first
Here's the trap Van Westendorp can walk you into: it assumes people want your product. Every one of those four questions presumes the respondent would consider buying at some price. Run a beautiful survey on an idea nobody actually wants and you'll get a clean, confident chart pointing at a price for a product that will sell zero units.
So the order matters. Demand first, price second. Before you spend an afternoon finding the perfect number, find out whether there's real, current appetite for the thing at all — the question we cover in reading market demand off Google. If the demand signal is dead, the pricing question is moot. If it's alive, Van Westendorp is exactly the right next tool for pricing your product right — the honest answer to "what do I charge?"
That sequencing is what an audit is built to enforce. When you run an idea through MakeOrKillIt, it reads live demand, competitors, and the strongest case against the idea, then gives you a reasoned Make / Hold / Kill — including where your pricing leverage is (charge B2B not B2C, position above the incumbent, and so on). It won't run a Van Westendorp survey for you; that's fieldwork only real buyers can answer. What it does is tell you whether the idea is worth pricing in the first place — and hand you the honest version of the answer, not the flattering one a chatbot gives.
Find out if the demand is there. Then go run your four questions.
FAQ
What is the Van Westendorp Price Sensitivity Meter?
It's a pricing research method that asks four open-ended questions about a product's price — too cheap, a bargain, getting expensive, and too expensive. Plotting the answers as cumulative curves reveals a range of acceptable prices and an optimal price point, without the researcher having to guess price points in advance. Peter van Westendorp introduced it at the 1976 ESOMAR Congress.
What are the four Van Westendorp questions?
At what price would this be so cheap you'd doubt its quality (too cheap)? At what price would it be a bargain — great value for the money (cheap)? At what price would it start to feel expensive, but you'd still consider it (expensive)? At what price is it so expensive you would not consider buying it (too expensive)? Respondents give a price for each.
What does the optimal price point (OPP) indicate?
The OPP is the intersection of the 'too cheap' and 'too expensive' curves — the price at which the fewest people reject the product on either extreme. It marks the point of lowest price resistance, not the price that maximizes revenue. Van Westendorp shows you an acceptable range, not the single profit-maximizing number.
What is the difference between Van Westendorp and Gabor-Granger?
Van Westendorp measures perceived price acceptability and gives you a range, but no sales volume. Gabor-Granger asks how likely someone is to buy at specific prices, producing a demand curve and a revenue-maximizing price. Use Van Westendorp to find the acceptable range, then Gabor-Granger to optimize within it.
How many respondents do you need for Van Westendorp?
Classic market-research practice uses a few hundred respondents per segment for stable curves. For an early founder, even 30 to 50 real target buyers gives directional signal worth acting on — as long as you treat it as a rough range, not a precise number, and you're surveying actual potential customers rather than friends.
Get the honest read on your own idea.
A reasoned Make / Hold / Kill in minutes — free, no signup.
Score an idea — free →